Investigation of hydromechanical processes during cyclic extraction recovery testing of a deformable rock fracture
Simon A. Mathias, Chin-Fu Tsang, Maarten van Reeuwijk
International Journal of Rock Mechanics and Mining Sciences · 2010
Abstract
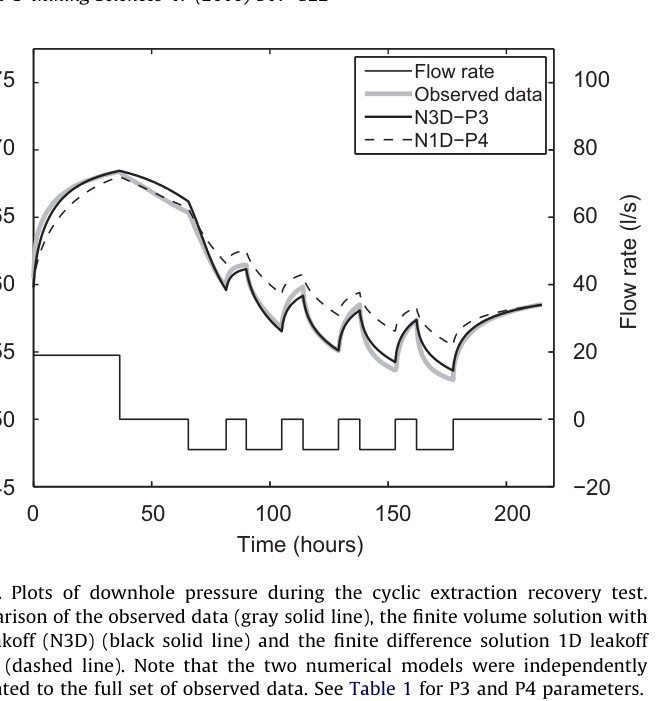
of calibration results. Properties P1 P2 P3 P4 Fracture radius, rF (m) 260 260 260 260 Effective stress coefficient, a (–) 1.0 1.0 1.0 1.0 Viscosity, m (Pa.s) 10/C0 3 10/C0 3 10/C0 3 10/C0 3 Initial effective stress, s0 n;0 (MPa) 10 100 10 10 Background pressure, P0 (MPa) 62 60 60 60 Normal permeability, kz ðm2 Þ 8:6 /C2 10/C0 16 1:3 /C2 10/C0 16 3:1 /C2 10/C0 16 1:0 /C2 10/C0 15 Radial permeability, kr ðm2 Þ ¼ kz ¼ kz ¼ kz 0 Initial fracture aperture, b0 (m) 3:4 /C2 10/C0 3 7:0 /C2 10/C0 4 7:3 /C2 10/C0 4 7:3 /C2 10/C0 4 Storage coefficient, S ðPa/C0 1 Þ 0 7:6 /C2 10/C0 12 2:2 /C2 10/C0 12 2:2 /C2 10/C0 12 Solution scheme used A3D N3D N3D N1D Adjustable parameters during calibration ðkz ; b0Þð kz ; SÞð kz ; b0 ; SÞð kz Þ Times included for minimizing MAE o110 h 4110 h all all MAE for time range above (MPa) 0.29 0.41 0.38 1.30 MAE for all times (MPa) 1.67 1.10 0.38 1.30 A3D: rigid rock matrix S ¼ 0; 3D leak-off; analytical. N3D: S 40; 3D leak-off; finite volume. N1D: S 4 0; 1D leak-off; finite difference. −20 0 20 40 60 80 100 Flow rate (l/s) 0 50 100 150 200 45 50 55 60 65 70 75 Downhole pressure (MPa) Time (hours) Flow rate Observed data A3D−P1 with S = 0 N3D−P1 with S = 10−14 Pa−1 N3D−P1 with S = 10−12 Pa−1 Fig. 1. Plots of downhole pressure during the cyclic extraction recovery test. Comparison of the observed data (gray solid line), the analytical solution (A3D) (for rigid rock matrix) (circular markers) and the finite volume solution (N3D) with a small (black solid line) and moderate (dashed line) rock storage coefficient. See Table 1 for P1 parameters. S.A. Mathias et al. / International Journal of Rock Mechanics & Mining Sciences 47 (2010) 517–522 519